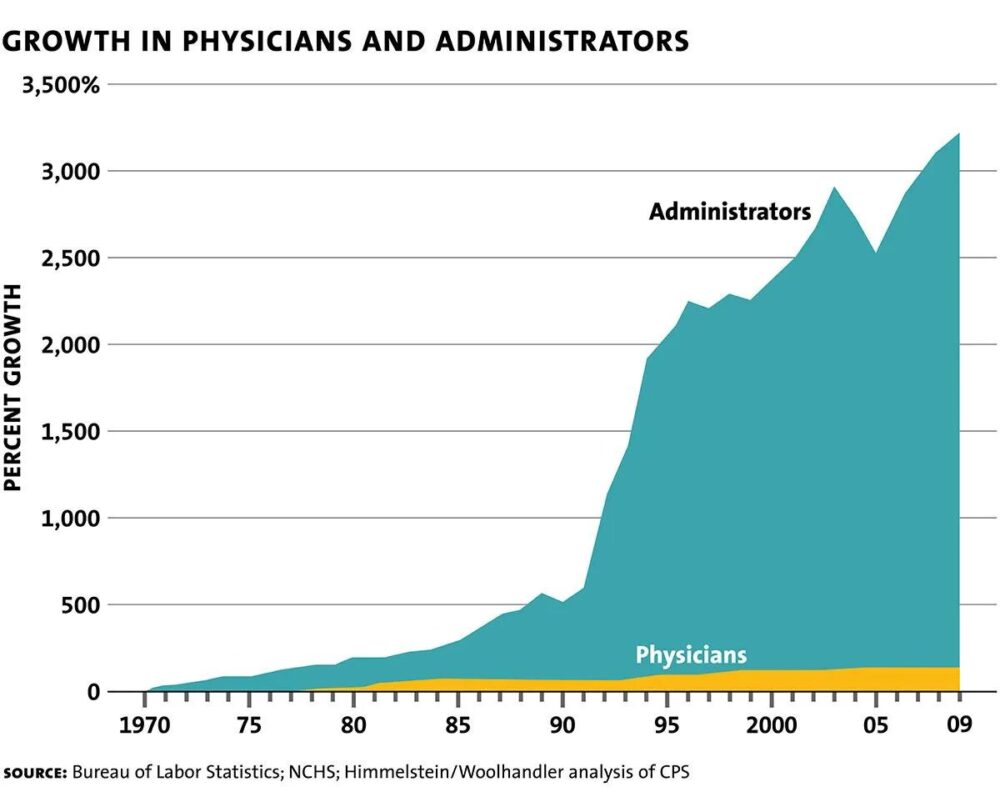
That looks fishy. Hospitals prior to 1978 had no physicians at all? Edit: my bad. The vertical coordinate is growth, not actual numbers. But you still need to see actual numbers as well as growth. This graph is pretty meaningless on its own.
In which a cat is the star of the show.


That looks fishy. Hospitals prior to 1978 had no physicians at all?
Edit: my bad. The vertical coordinate is growth, not actual numbers. But you still need to see actual numbers as well as growth. This graph is pretty meaningless on its own.